Analytics Consulting for SMBs
Stop guessing. Build a measurement framework that gives you confidence in every decision.
Analytics Services
From strategy to implementation
Ideal For Teams Who...
Recognize the signs that it's time to level up their analytics
Rely on manual spreadsheets and spend hours compiling reports instead of analyzing data
Different teams use different metrics and definitions, leading to conflicting reports
Can't answer basic questions about business performance without significant effort
Want to make decisions based on data, not hunches, but lack the foundation
Blind
No structured measurement or analytics
Basic
Some tracking in place, inconsistent implementation
Defined
Comprehensive measurement framework with consistent tracking
Advanced
Predictive analytics and optimization loops
Optimized
AI-driven insights and autonomous decision-making
Metrics Snapshot
A sample view of how we translate messy inputs into a clean, decision-ready scorecard.
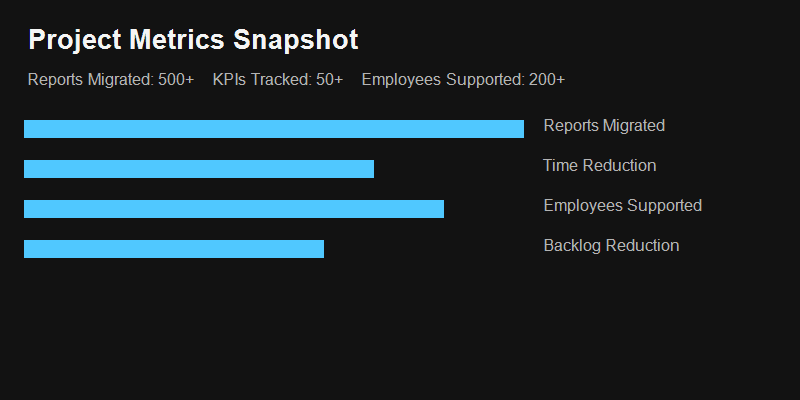
Example scorecard built from real client engagement data.
Decision Making
Decisions based on hunches and incomplete information
Data-driven decisions backed by real customer behavior and business metrics
Time to Insight
Manual reports taking 8+ hours to compile each week
Real-time dashboards with automated alerts for critical changes
Measurement Accuracy
Inconsistent tracking leads to conflicting metrics across teams
Single source of truth with consistent, auditable measurement
ROI Visibility
Can't clearly attribute revenue to marketing or product changes
Clear attribution and ROI tracking for every initiative
Implementation Phases
A phased rollout that aligns goals, data, and delivery
What You Get
A complete analytics solution, not just a one-time setup.
- KPI framework document
- Event tracking specification
- Dashboard implementation
- Documentation and training
- Ongoing support and iteration
Tools I Work With
Client Success Stories
Real results from analytics transformations
Action: Partnered with a data scientist to build and operationalize a forecasting model at the geographic quota-group level, incorporating seasonality, promotions/marketing effects, local trend signals, and operational factors. Translated forecasts into workforce planning inputs for hiring pipeline timing, training readiness, and scheduling capacity.
Results:
- Shifted from reactive to proactive capacity planning
- Improved hiring and scheduling alignment with demand patterns
- Enabled readiness for volume increases before they hit
Action: Consolidated survey outcomes into a unified dataset spanning sales and service. Joined to global dealer personnel training records. Built a recommendation model in R using classification and regression approaches including Random Forest, producing recommended courses by deficiency pattern. Delivered outputs in Tableau with individual employee drill-down and dealership rollups.
Results:
- Enabled targeted training interventions by specific deficiency pattern
- Shifted training from generic pushes to evidence-based recommendations
- Provided dealership managers with actionable employee-level insights
Action: Built risk tiering and visit-frequency recommendation models using classification and regression including Random Forest. Combined diagnostic codes with utilization and treatment signals, enriched with census and public data for contextual risk factors. Embedded outputs into call-center care manager workflows to steer patients toward primary care and virtual visits when appropriate.
Results:
- More frequent engagement and proactive routing toward primary and virtual care
- Aligned interventions with program goal of reducing avoidable ED visits
- Operationalized risk scores directly into care manager workflows
Helpful Resources
Guides and templates to help you get started
Analytics Consulting FAQ
Common questions about analytics consulting and KPI frameworks
A KPI framework is a structured approach to measuring business performance. It defines what metrics matter for your business, how to track them, and how to use them for decision-making. Without one, you're making decisions based on incomplete or inconsistent data.
Typical timeline is 4-8 weeks depending on complexity. We start with a discovery phase to understand your goals, then build event tracking specifications, implement tracking, validate data, and finally create dashboards. The goal is to get you actionable insights quickly while building for long-term scalability.
We work with Google Analytics 4, Mixpanel, Amplitude, PostHog, and custom SQL databases. The tool choice depends on your needs, budget, and technical setup. We'll recommend the best fit during our discovery phase.
Not necessarily. Many SMBs benefit from getting their measurement infrastructure right first, then using consultants or fractional support. Once you have clean data and good dashboards, your team can make data-driven decisions without a dedicated analyst. We can help you determine what makes sense for your stage and budget.
We track ROI through improved decision velocity (faster, more confident decisions), time saved on manual reporting, and the business impact of data-driven changes. Most clients see ROI within 3-6 months through better resource allocation, reduced wasted spend, and faster identification of growth opportunities.
We follow security best practices including encrypted data handling, role-based access controls, and compliance with GDPR and other regulations. We can work within your existing security requirements and sign NDAs and data processing agreements as needed.
Yes, we work with most common BI platforms including Tableau, Power BI, Looker Studio, and Metabase. We can extend your current setup rather than starting from scratch, or we can help you evaluate whether new tools would serve you better.
That's fine. We'll work with what you have and help you implement proper tracking going forward. Even a few months of clean data can provide valuable insights. The important thing is to start building a solid data foundation for the future.
Yes, we offer ongoing support retainers for maintenance, updates, and new analytics initiatives. Many clients start with an implementation project and then continue with monthly support as their needs evolve.
We can help you build the business case by quantifying current pain points (time spent on manual reporting, cost of bad decisions) and projecting ROI from improved analytics. Most analytics investments pay for themselves within 6-18 months through time savings and better decision-making.
Ready to Make Data-Driven Decisions?
Let's discuss your analytics needs and build a measurement framework that works for your business.